接下来进入到实验1的第三个部分,第三部分的主要目标是探索操作系统初始化的过程,包括初始化屏幕显示和初始化栈。
练习7:使用虚拟内存来解决位置依赖问题
Exercise 7. Use QEMU and GDB to trace into the JOS kernel and stop at the movl %eax, %cr0. Examine memory at 0x00100000 and at 0xf0100000. Now, single step over that instruction using the stepi GDB command. Again, examine memory at 0x00100000 and at 0xf0100000. Make sure you understand what just happened.
What is the first instruction after the new mapping is established that would fail to work properly if the mapping weren’t in place? Comment out the movl %eax, %cr0 in kern/entry.S, trace into it, and see if you were right.
练习7主要是理解虚拟内存,跟踪调试JOS kernel,在movl %eax,%cr0处停止。查看0x00100000处和0xf0100000处的内存内容。然后使用si指令单步调试。再一次查看
0x00100000处和0xf0100000处的内存内容。确定你理解了刚才发生了什么。
先简单分析下这个练习,movl %eax, %cr0这条指令意味着从实模式进入保护模式。在这里设置一个断点,
- 执行到这个断点时,处理器还处于实模式,因此0x00100000和0xf0100000对应的内存是实模式下的,高地址内核区域还没有映射到内核的物理地址,而只有低地址是有效的。
- 单步执行后,对应的内存是保护模式下的(虚拟地址),而保护模式下,开启分页之后,由于有静态映射表的存在(kern/entrypgdir.c),两块虚拟地址都指向同一块物理地址区域,二者的内存应该是一致的。
下面通过实验验证一下这个猜想,movl %eax, %cr0这条指令在boot.asm中可以找到地址:0x7c2a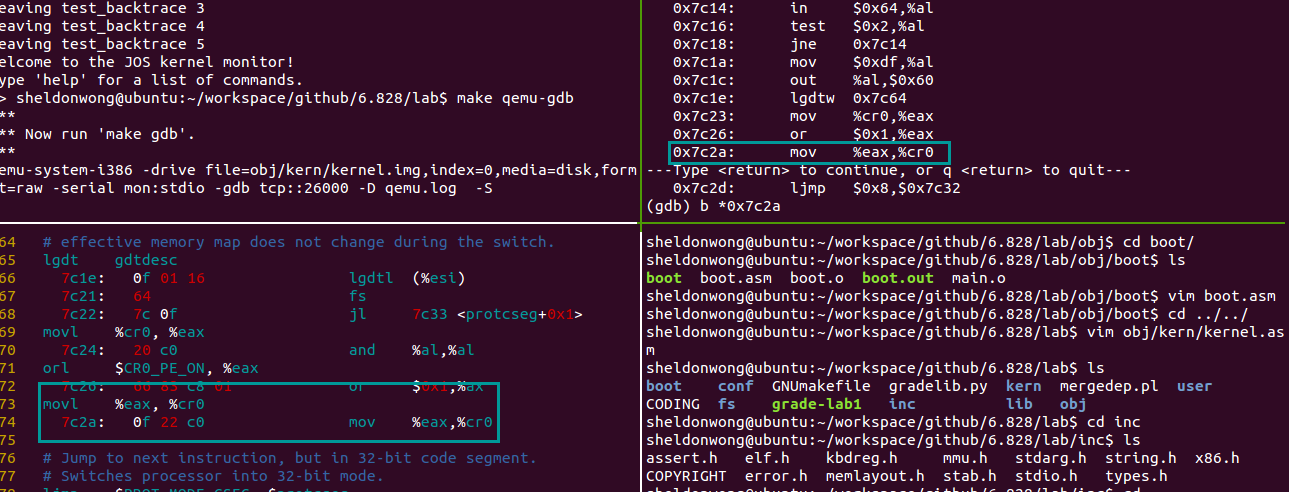
但是我们现在0x7c26这里设置个断点,执行到此处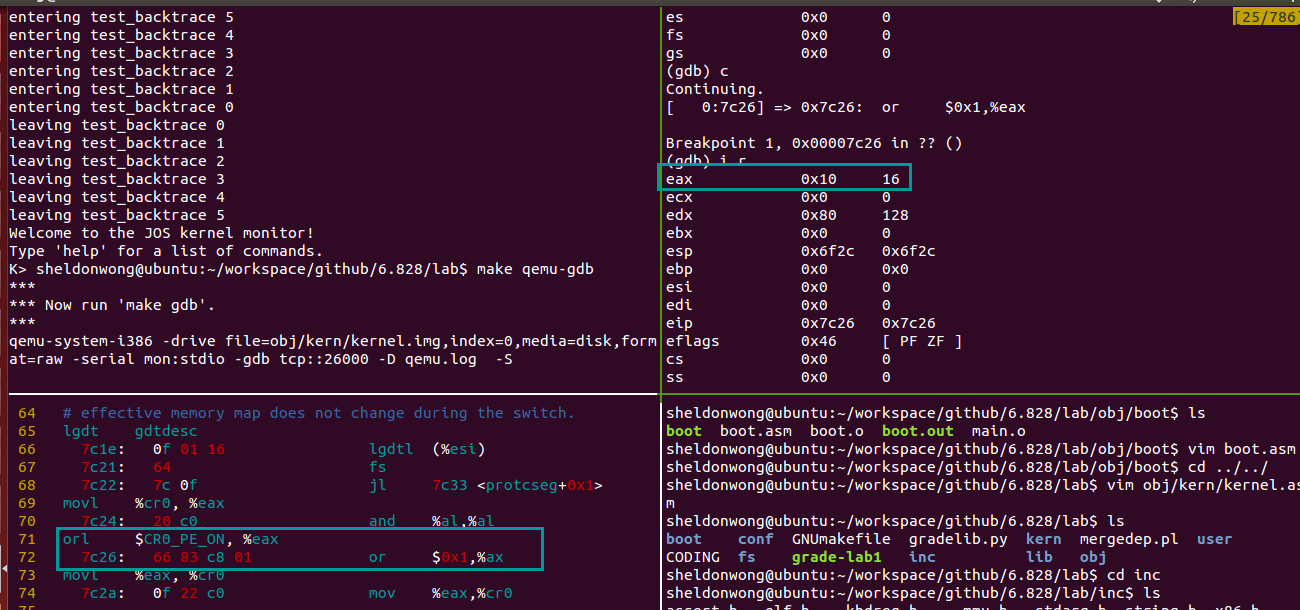
在执行si,结果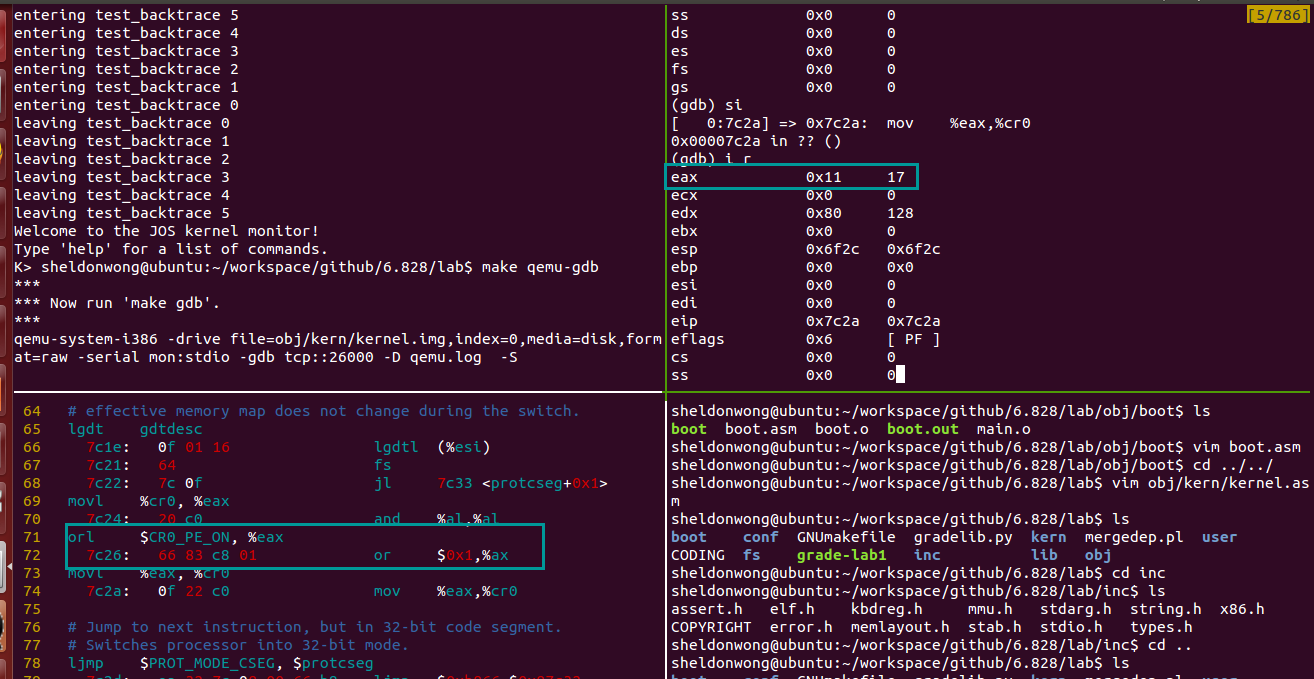
可以知道,执行到断点意味着断点还未被执行,si之后就执行了。把%eax寄存器末位置1之后,在mov到cr0中,就开启了保护模式。这里需要注意的是,要观察的两个地址,0x00100000和0xf0100000都是虚拟地址空间地址。
练习8:格式化输出到控制台
Most people take functions like printf() for granted, sometimes even thinking of them as “primitives” of the C language. But in an OS kernel, we have to implement all I/O ourselves.
Read through kern/printf.c, lib/printfmt.c, and kern/console.c, and make sure you understand their relationship. It will become clear in later labs why printfmt.c is located in the separate lib directory.
Exercise 8. We have omitted a small fragment of code - the code necessary to print octal numbers using patterns of the form “%o”. Find and fill in this code fragment.
练习8主要是填代码,这些代码是为了打印8进制数。要填写的代码文件位于lib/printfmt.c中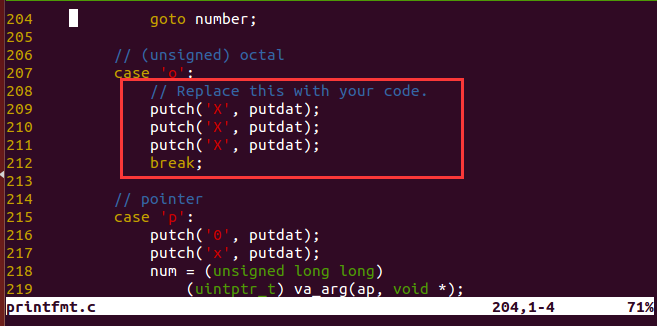
仿照上面的10进制格式化输出,添加了三行代码: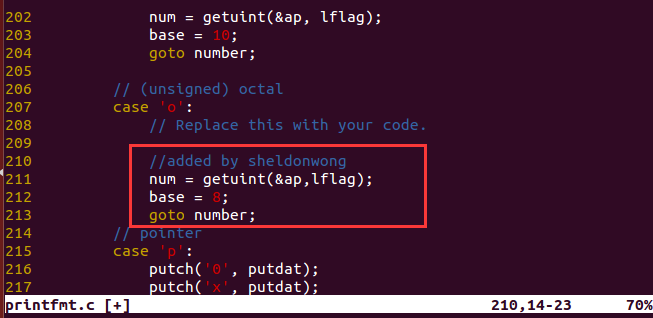
Be able to answer the following questions:
- Explain the interface between printf.c and console.c. Specifically, what function does console.c export? How is this function used by printf.c?
解释printf.c和console.c之间的接口。具体来说,console.c导出了什么函数?printf.c是怎样使用这个函数的?
printf.c实际上是console.c的一层“外壳”,其API的具体操作的实现都在console.c中。具体来说,console.c为printf.c提供了cputchar()这个接口。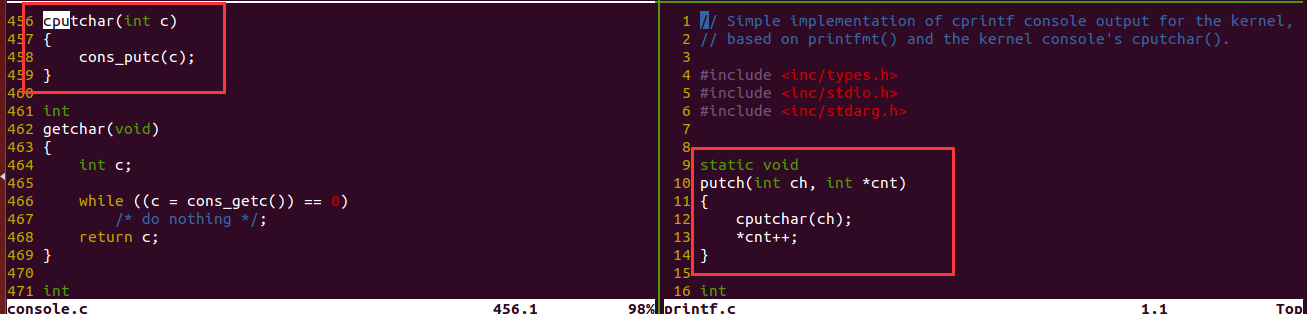
- Explain the following from console.c:
1
2
3
4
5
6
7
if (crt_pos >= CRT_SIZE) {
int i;
memmove(crt_buf, crt_buf + CRT_COLS, (CRT_SIZE - CRT_COLS) * sizeof(uint16_t));
for (i = CRT_SIZE - CRT_COLS; i < CRT_SIZE; i++)
crt_buf[i] = 0x0700 | ' ';
crt_pos -= CRT_COLS;
}
解释这段代码,先看一下相关函数及预定义: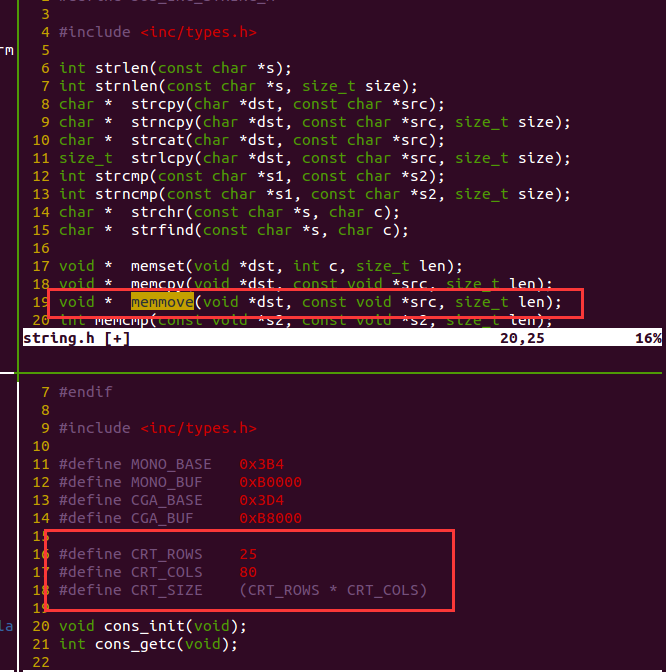
接下来看一下memmove这个函数,其函数原型是:
void memmove(void dest, const void *src, size_t num);
作用是将src开始的num个byte内容复制到dest指向的地址。一个实例:1
2
3
4
5
6
7
8
9
10
11
int main ()
{
char str[] = "memmove can be very useful......";
memmove (str+20,str+15,11);
puts (str);
system("pause");
return 0;
}
运行结果:
memmove can be very very useful.
这段代码能够很好的说明内存重叠时的情况:先将内容复制到类似缓冲区的地方,再用缓冲区中的内容覆盖 dest 指向的内存,请看下图。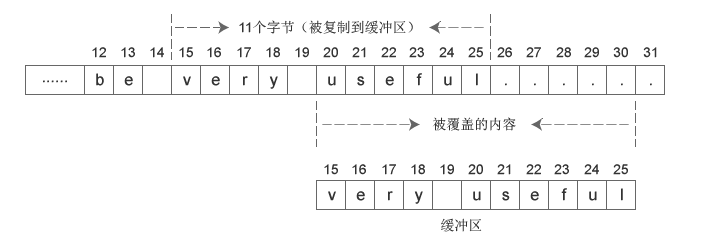
CRT_SIZE意即屏幕缓冲大小,25*80,这段代码主要是检测屏幕缓冲区是否满了,如果满了,就把crt_buf + CRT_COLS指针指向的n个byte复制到crt_buf指向的地方,n byte 由memmove()函数的第三个参数指定。这里crt_pos应该是在缓冲区中移动,crt_buf是内存中的其他区域。也就是当屏幕缓冲区满了,就把内容复制到crt_buf指向的地址,接下来在把屏幕缓冲区最后一行清空,最后crt_pos初始化,最后一句代码的意思是把把crt_pos定位到最后一行的开始位置;
画了个图,将就看吧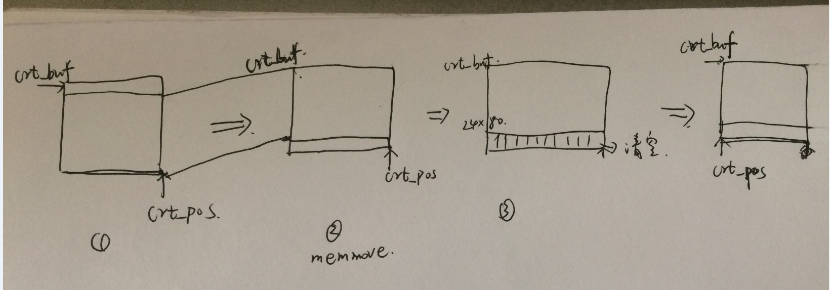
- For the following questions you might wish to consult the notes for Lecture 2. These notes cover GCC’s calling convention on the x86.
Trace the execution of the following code step-by-step:1
2int x = 1, y = 3, z = 4;
cprintf("x %d, y %x, z %d\n", x, y, z);
In the call to cprintf(), to what does fmt point? To what does ap point?
List (in order of execution) each call to cons_putc, va_arg, and vcprintf. For cons_putc, list its argument as well. For va_arg, list what ap points to before and after the call. For vcprintf list the values of its two arguments.
对于以下问题,您可能希望参考第2讲的笔记。这些笔记包括GCC在x86上的调用约定。一步一步跟踪以下代码的执行。
- Run the following code.
unsigned int i = 0x00646c72;
cprintf(“H%x Wo%s”, 57616, &i);
What is the output? Explain how this output is arrived at in the step-by-step manner of the previous exercise. Here’s an ASCII table that maps bytes to characters.
The output depends on that fact that the x86 is little-endian. If the x86 were instead big-endian what would you set i to in order to yield the same output? Would you need to change 57616 to a different value?
Here’s a description of little- and big-endian and a more whimsical description.
- In the following code, what is going to be printed after ‘y=’? (note: the answer is not a specific value.) Why does this happen?
cprintf(“x=%d y=%d”, 3); - Let’s say that GCC changed its calling convention so that it pushed arguments on the stack in declaration order, so that the last argument is pushed last. How would you have to change cprintf or its interface so that it would still be possible to pass it a variable number of arguments?
Challenge
Challenge Enhance the console to allow text to be printed in different colors. The traditional way to do this is to make it interpret ANSI escape sequences embedded in the text strings printed to the console, but you may use any mechanism you like. There is plenty of information on the 6.828 reference page and elsewhere on the web on programming the VGA display hardware. If you’re feeling really adventurous, you could try switching the VGA hardware into a graphics mode and making the console draw text onto the graphical frame buffer.
栈部分
练习9:
Exercise 9. Determine where the kernel initializes its stack, and exactly where in memory its stack is located. How does the kernel reserve space for its stack? And at which “end” of this reserved area is the stack pointer initialized to point to?
练习10:
Exercise 10. To become familiar with the C calling conventions on the x86, find the address of the test_backtrace function in obj/kern/kernel.asm, set a breakpoint there, and examine what happens each time it gets called after the kernel starts. How many 32-bit words does each recursive nesting level of test_backtrace push on the stack, and what are those words?
Note that, for this exercise to work properly, you should be using the patched version of QEMU available on the tools page or on Athena. Otherwise, you’ll have to manually translate all breakpoint and memory addresses to linear addresses.
练习11:
Exercise 11. Implement the backtrace function as specified above. Use the same format as in the example, since otherwise the grading script will be confused. When you think you have it working right, run make grade to see if its output conforms to what our grading script expects, and fix it if it doesn’t. After you have handed in your Lab 1 code, you are welcome to change the output format of the backtrace function any way you like.
If you use read_ebp(), note that GCC may generate “optimized” code that calls read_ebp() before mon_backtrace()’s function prologue, which results in an incomplete stack trace (the stack frame of the most recent function call is missing). While we have tried to disable optimizations that cause this reordering, you may want to examine the assembly of mon_backtrace() and make sure the call to read_ebp() is happening after the function prologue.
#练习12
Exercise 12. Modify your stack backtrace function to display, for each eip, the function name, source file name, and line number corresponding to that eip.
In debuginfoeip, where do __STAB* come from? This question has a long answer; to help you to discover the answer, here are some things you might want to do:
look in the file kern/kernel.ld for _STAB*
run i386-jos-elf-objdump -h obj/kern/kernel
run i386-jos-elf-objdump -G obj/kern/kernel
run i386-jos-elf-gcc -pipe -nostdinc -O2 -fno-builtin -I. -MD -Wall -Wno-format -DJOS_KERNEL -gstabs -c -S kern/init.c, and look at init.s.
see if the bootloader loads the symbol table in memory as part of loading the kernel binary
Complete the implementation of debuginfo_eip by inserting the call to stab_binsearch to find the line number for an address.
Add a backtrace command to the kernel monitor, and extend your implementation of mon_backtrace to call debuginfo_eip and print a line for each stack frame of the form:
K> backtrace
Stack backtrace:
ebp f010ff78 eip f01008ae args 00000001 f010ff8c 00000000 f0110580 00000000
kern/monitor.c:143: monitor+106
ebp f010ffd8 eip f0100193 args 00000000 00001aac 00000660 00000000 00000000
kern/init.c:49: i386_init+59
ebp f010fff8 eip f010003d args 00000000 00000000 0000ffff 10cf9a00 0000ffff
kern/entry.S:70:
K>
Each line gives the file name and line within that file of the stack frame’s eip, followed by the name of the function and the offset of the eip from the first instruction of the function (e.g., monitor+106 means the return eip is 106 bytes past the beginning of monitor).
Be sure to print the file and function names on a separate line, to avoid confusing the grading script.
Tip: printf format strings provide an easy, albeit obscure, way to print non-null-terminated strings like those in STABS tables. printf(“%.*s”, length, string) prints at most length characters of string. Take a look at the printf man page to find out why this works.
You may find that some functions are missing from the backtrace. For example, you will probably see a call to monitor() but not to runcmd(). This is because the compiler in-lines some function calls. Other optimizations may cause you to see unexpected line numbers. If you get rid of the -O2 from GNUMakefile, the backtraces may make more sense (but your kernel will run more slowly).